Date: 13-FEBRUARY-2014 Last Update: 31-AUGUST-2026
Compounds Shown were Extracted from Commercial Rice
Overview
Phenolic acids are important naturally occurring compounds found in many foods, grains, fruits, and vegetables. These compounds are often studied because of their potential contribution to product quality, nutritional value, and biological activity.
This application demonstrates the analysis of ten phenolic acid standards spiked into a commercial rice extract and analyzed using LC-MS with a Cogent™ Phenyl Hydride HPLC Column.
The method provided excellent retention and separation of aromatic phenolic compounds while maintaining LC-MS compatibility through the use of a simple volatile mobile phase.
Application Highlights
The Cogent™ Phenyl Hydride column was selected for this analysis because its phenyl functionality can provide beneficial aromatic interactions that enhance retention and selectivity for phenolic compounds.
The method demonstrated:
- Excellent retention of aromatic acids
- Good peak symmetry
- Effective LC-MS compatibility
- Reliable analyte identification using retention time and mass spectral information
- Suitability for food and agricultural sample analysis
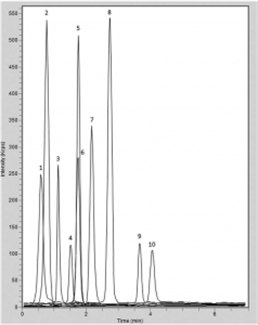
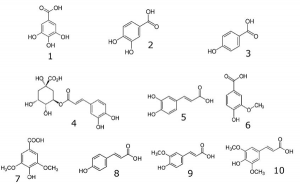
Peaks:
1. Gallic Acid 169 m/z [M-H]–
2. 3,4-Hydroxybenzoic Acid 153 m/z [M-H]–
3. 4-Hydroxybenzoic Acid 137 m/z [M-H]–
4. Chlorogenic Acid 353 m/z [M-H]–
5. Caffeic Acid 179 m/z [M-H]–
6. Vanillic Acid 167 m/z [M-H]–
7. Syringic Acid 197 m/z [M-H]–
8. p-Coumaric Acid 163 m/z [M-H]–
9. Ferulic Acid 193 m/z [M-H]–
10. 3,5-Dimethoxy-4-Hydroxycinnamic A cid 223 m/z [M-H]–
Column: Cogent Phenyl Hydride™, 4 μm, 100 Å
Catalog No.: 69020-05P-2
Dimensions: 2.1 x 50 mm
Mobile Phase:
- A: DI Water / 0.1% Formic Acid (v/v)
- B: Acetonitrile / 0.1% Formic Acid (v/v)
Gradient:
| Time (minutes) | %B |
|---|---|
| 0 | 10 |
| 5 | 20 |
| 6 | 20 |
| 7 | 10 |
Post Time: 3 minutes
Injection vol.:1 μL
Flow rate: 0.4 mL / minute
Detection: ESI – Neg - Perkin Elmer, Flexar SQ 300 Mass Spectrometer
Sample Preparation: Commercial Rice Extract 3 was spiked with standards @ 12.5 ppm.
t 0 : 0.5 minutes
Notes: After the Separation Method was developed, several rice extracts were analyzed and compounds from the group of available standards were detected based on m/z values and Retention Time. Peaks for the two compounds Caffeic and Vanillic Acids were not Separated but since these compounds have very different m/z values, it was possible to determine their presence in a rice extract.