Date: 15-MAY-2013 Last Updated: 5-SEPTEMBER-2026
Introduction
Peak shape is an important indicator of chromatographic performance in HPLC, UHPLC, and LC-MS methods. In addition to retention time, efficiency, and resolution, peak symmetry is commonly evaluated during method development, system suitability testing, and troubleshooting investigations.
One of the most widely used peak shape measurements is the Asymmetry Factor (As). This value provides a quantitative assessment of peak tailing or fronting and can help determine whether a chromatographic system is performing within acceptable limits.
What Is the Asymmetry Factor?
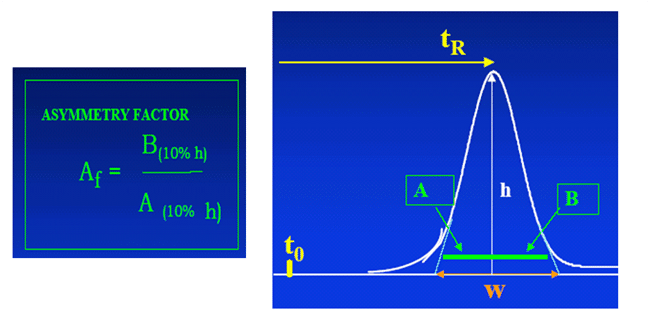
The asymmetry factor is a numerical expression of peak symmetry measured at 10% of the peak height. A perfectly symmetrical peak produces identical peak widths on both sides of the peak apex. As peaks become distorted, the asymmetry factor moves away from the ideal value.
The asymmetry factor is used to evaluate:
- Column performance
- System suitability
- Peak tailing
- Peak fronting
- Method robustness
- Chromatographic efficiency
How the Asymmetry Factor Is Measured
At 10% of the peak height:
- Measure the distance from the peak apex to the left side of the peak.
- Measure the distance from the peak apex to the right side of the peak.
These measurements are designated as:
- A = Left half-width at 10% peak height
- B = Right half-width at 10% peak height
The asymmetry factor is then calculated as:
[INSERT ASYMMETRY FACTOR FORMULA GRAPHIC HERE]
Suggested Caption:
Asymmetry Factor (As) calculation using peak widths measured at 10% of peak height.
Chromatographic Peak Measurement Example
Ideal Peak Shape
Asymmetry Factor = 1.0 A value of 1.0 indicates a perfectly symmetrical chromatographic peak.
Acceptable Peak Shape
Asymmetry Factor = 0.9 to 1.2 This range is generally considered acceptable for most HPLC applications and system suitability requirements.
Peak Fronting
Asymmetry Factor < 1.0 Values below 1 indicate peak fronting, where the leading edge of the peak is broader than the trailing edge.
Potential causes may include:
- Column overload
- Injection solvent effects
- Sample concentration issues
- Method development problems
Peak Tailing
Asymmetry Factor > 1.0 Values above 1 indicate peak tailing, where the trailing edge of the peak is broader than the leading edge.
Potential causes may include:
- Secondary analyte interactions
- Active sites within the system
- Column contamination
- Improper mobile phase conditions
- Poor fluid-path connections
Unacceptable Peak Shape
Asymmetry Factor > 2.0 Values greater than 2 are generally considered unacceptable and often indicate a significant chromatographic problem that should be investigated.
Why Peak Symmetry Matters
Peak asymmetry can directly affect:
- Quantitative accuracy
- Resolution
- Peak integration
- Method reproducibility
- Detection limits
- System suitability performance
Monitoring asymmetry factor values helps chromatographers identify developing system issues before they become significant analytical problems.
Common Applications
Asymmetry factor measurements are commonly used in:
- HPLC method development
- UHPLC method validation
- LC-MS methods
- Pharmaceutical analysis
- Stability studies
- Quality control testing
- Regulatory system suitability protocols
Many chromatographic data systems automatically calculate asymmetry factors during routine analyses.
Conclusion
The asymmetry factor provides a simple and effective way to evaluate chromatographic peak shape. By measuring the left and right peak widths at 10% peak height and calculating the ratio of B to A, chromatographers can assess peak symmetry and identify potential issues affecting method performance. Values near 1.0 indicate excellent peak shape, while values significantly above or below 1 may require further investigation.